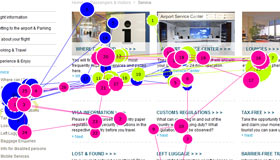
Gaze Plots
Gaze plots are, besides heatmaps and opacity maps, another graphical representation of eye tracking study results.
When participants look at a specific location, the area theyare looking at is marked by a circle. The longer the areawas fixated, the bigger the circle gets. In the end, aseries of numbered circles visualize the movements of theeye. Thereby, different colors represent the eye movementsof different participants. Between the circles, the eyejumps. This jump is called saccade. During saccades, humanscannot see, but because these eye movements are very fast,humans are not aware of it.

